| мқҙмҠ№нҷҳ, к№Җм„ұнҷҳ, л°•лҚ•мҡ°, к°•мҲҳ진, к№ҖмҳҒн•ҷ, мқҙмІ нҷҳ, к№Җмһ¬мӨ‘, л°•м„ұмҡұ, л°•мҠ№м •, MAIN-COMPARE investigators |
Background: We sought to compare long-term outcomes between drug-eluting stent (DES) and coronary artery bypass graft (CABG) in ostial left main coronary artery (LMCA).
Methods: In the MAIN-COMPARE registry, 416 patients with isolated ostial LMCA stenosis were selected. Of these, 132 were treated with PCI of DES and 150 with CABG. We compared the 3-years outcome of death, the composite event of death, Q-wave myocardial infarction, or stroke, and target vessel revascularization (TVR).
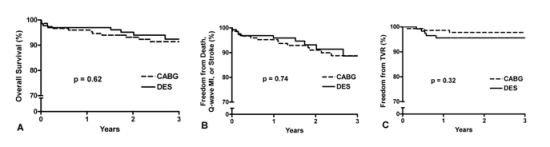
Results: In unadjusted analysis, there is no significant difference of overall mortality (91% vs. 92%, CABG vs. DES, p=0.62), the composite events (11% vs. 13%, CABG vs. DES, p=0.74), and TVR (2% vs. 4%, CABG vs. DES, p=0.32) according to the treatment (Figure). In multivariable adjusted Cox regression analysis, there was also no significant difference among treatment groups in TVR (hazard ratio [HR], 1.81; 95% confidence interval [CI], 0.43 to 7.60, p=0.42) as well as death (HR, 0.99; 95% CI, 0.38 to 2.59, p=0.98) and the composite events (HR, 1.08; 95% CI, 0.45 to 2.60, p=0.87). These results were sustained after propensity score adjustment and propensity score matching analysis (Table).
Conclusions: In ostial LMCA, DES implantation showed favorable 3 years outcomes compared to CABG, and these benefits remain consistent after meticulous adjustments for confounders. Especially, the rate of TVR was even similar between DES group and CABG group.
|